


-
-
CIO INSIGHTS
-
 BACK TO CIO INSIGHTS
BACK TO ARTICLES & INSIGHTS HOME
BACK TO CIO INSIGHTS
BACK TO ARTICLES & INSIGHTS HOME
-
-
-
![Michael Rosen]()
-
Investment Insights are written by Angeles' CIO Michael Rosen
Michael has more than 30 years experience as an institutional portfolio manager, investment strategist, trader and academic.
INSIDE THE TRIANGLE
Published: 05-23-2016Complexity makes investing so challenging. Unlike the pure sciences, there are no hard truths in investing, no discoverable axioms that determine outcomes with 100% confidence. At best, we can speak in probabilities, but even these probabilities come with large standard errors. Investing demands humility, even from the best of us.
This complexity comes from the infinite number of variables that affect investments. These variables are not just economic and financial, but also political, social and emotional. Investing cannot be reduced to a formula or an algorithm, however many Greek letters they may contain. It’s not just the sheer number of factors at work, it’s also the constantly changing interaction and effects each of the variables has on the others, resulting in a geometric explosion in complexity.
One traditional approach is to ignore all this: set a fixed asset allocation, and never vary. This is a perfectly legitimate strategy, but one that requires a number of conditions that rarely co-exist among investors:- The asset pool must serve long-term needs, as any significant cash flows in or out of the pool risk occurring at a time detrimental to the long-term goals of the investor.
- Risky assets will have higher future returns than safe assets.
- The future return of a portfolio will be adequate, in absolute terms, to meet the needs of the investor.
These conditions are suspect. Many investors have significant cash flows in or out of their portfolio at inopportune times. An investor who retired in 2009, for example, likely had a pool of savings that was considerably less than it would have been a year earlier. Many endowments and foundations see their cash needs increase when portfolios values are lowest, thus draining assets at the worst time.
It’s unusual, but risky assets don’t always outperform safe assets over all periods. From 2000-2008, the S&P 500 Index lost 3.6% p.a., while long-term US government bonds gained 10.5% p.a. in that period. From 1966 to 1974, US stocks advanced just 0.1% p.a., while US government bonds returned 2.4% p.a. Between 1929 and 1942, US stocks lost 1% annually, while government bonds compounded at +4.5%.
The third point is most questionable today. Long-term government bonds yield less than 2% around the world; in much of Europe and Japan yields are even below zero. Future stock returns are uncertain, but most would estimate absolute returns to be well below historical levels. There is a substantial risk that a diversified investment portfolio will fall short, even well short, of investors’ required returns.
A fixed asset allocation does have one important distinguishing value: it stops investors from harming themselves. This is not to be underestimated. According to consulting firm Dalbar, over the past 30 years (ending 2014) the average retail investor failed to keep pace with inflation, earning 2.47% p.a. to inflation’s 2.70% rise. Forget coming to close to bonds (+7.36%) or US stocks (+11.06%). High fees are only partly to blame; this level of underperformance comes from (bad) investors’ decisions to buy high and sell low by chasing fads on the upside and bailing out at the bottom.
Thus far, I’ve presented only problems:
- Investing is complex beyond comprehension, by human or computer.
- A fixed asset allocation solves the problem of complexity by ignoring it, but suffers real limitations.
- Investor behavior is harmful to investors.
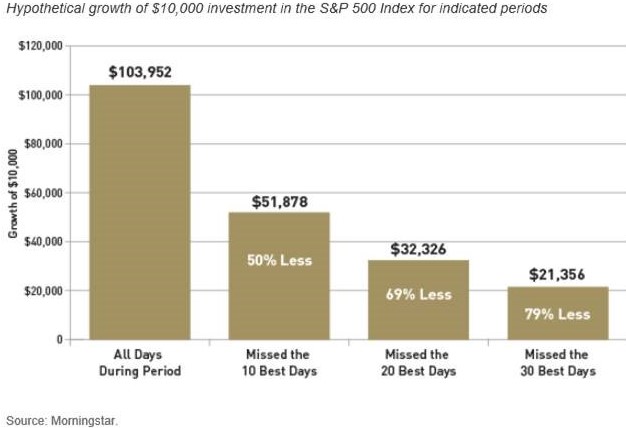
If a fixed allocation is problematic, constantly shifting strategy is likely to be worse, for two main reasons. First, as we saw in the Dalbar study, decisions are almost always wrong because successful investing is counter-intuitive, not intuitive. The moment of maximum pain (blood on the streets in Nathan Rothschild’s memorable phrase) is the best time to invest, and when markets are most euphoric is the worst time to invest. Secondly, even if we can avoid the behavioral harm we self-inflict, timing markets is impossible. Not hard, not difficult; impossible. The reason is that the majority of market returns occur in a very small number of periods. Over the past 6,000 days (25 years), an equity investor that missed the best 10 saw his return cut in half (see below). Successful timers do not have to be correct just more than half the time; they have to be right, consistently, nearly all the time. Impossible.
I’ve presented two approaches at the opposite ends of the spectrum: never altering strategy in light of market conditions, and always shifting strategy to anticipate future movements. I’ve explained why both are unsatisfactory. But we still need a framework that balances all of these forces at work in order to give us a way to formulate our investment strategy. For me, that frame takes the shape of a triangle.
I noted above that the influences affecting investing are infinitely complex, involving economic, financial, political, social and psychological factors. I said that no formula or algorithm can fully capture these variables, but three general categories of quantifiable factors can frame our analyses: Momentum, Valuation and Sentiment.
Momentum refers to a trend, up or down. It is surprisingly difficult to know if markets are trending higher or lower without looking at the historical pattern. It’s hard to see the forest through the trees. Trend analyses are used by traders to time their trades, but investors need to know if we are in a bull or a bear market. Of course, bull and bear markets do not move in straight lines, but with sufficient perspective, short-term fluctuations smooth out, and we can answer the simple question of whether a market is trending higher or lower. If higher, we generally want to maintain our exposures; if lower, we generally want to reduce them.
I noted in my last quarterly letter (https://angeles-srv.s3.amazonaws.com/content./1462378111./angeles-commentary-1q16.pdf)
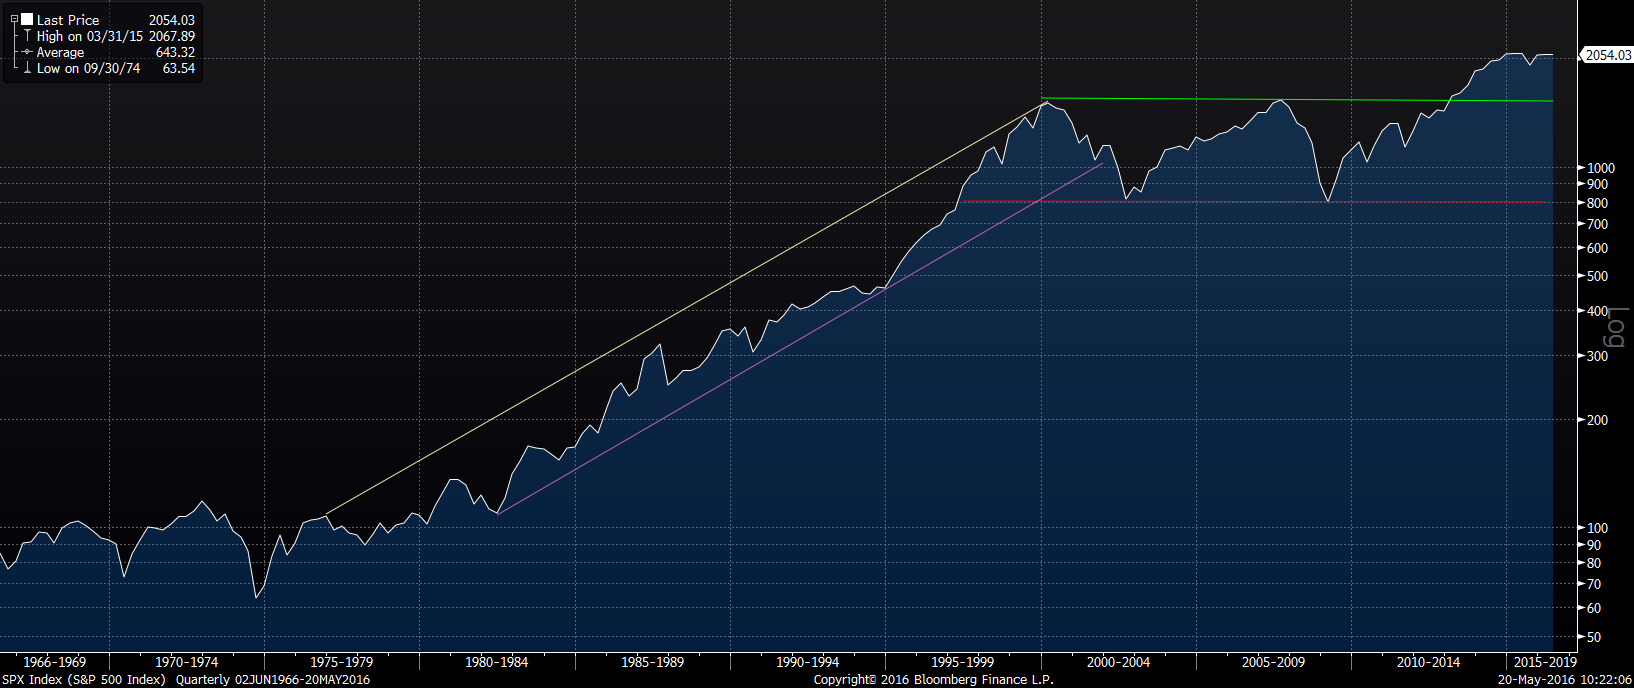
that the S&P 500 Index has traded between 1850 and 2150 all but six days in the past two years. So, over the medium-term, US equities are neither in a bull nor a bear market; they are just bouncing around in a range, biding time. But with a longer-term perspective, we see that US equities broke out of their 2000-2013 range to the upside. If my investment horizon were measured in decades, I would conclude that US equities are in a structural bull market and I want to maintain exposure to this asset. The graph below, in semi-log scale, shows the S&P 500 Index from 1966 through today.
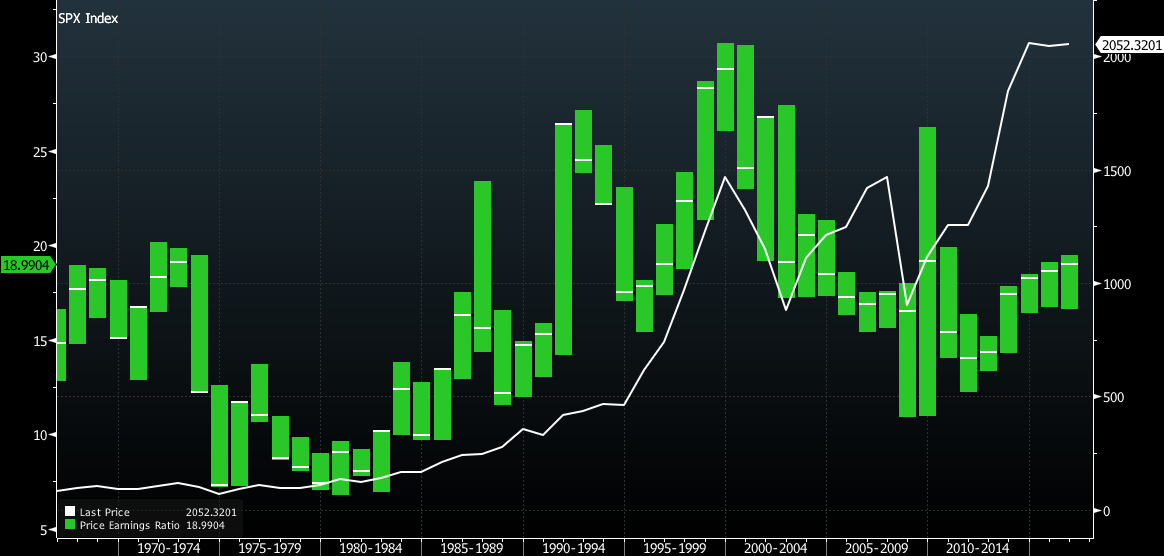
Valuation refers to whether an asset is cheap or expensive, which means its future return will be high or low, respectively. There are many valuation metrics, and the best approach is to review as many as possible to weigh the preponderance of the evidence. A common metric is the price-to-earnings (P/E) ratio. Since 1966, the P/E ratio of the S&P 500 Index has averaged about 16.5x, with a high of 29x in 1999 and a low of 7x in 1974 (see graph below). The current level of 19x says to me that current valuations are not especially cheap, but they’re not grosslyexpensive either.
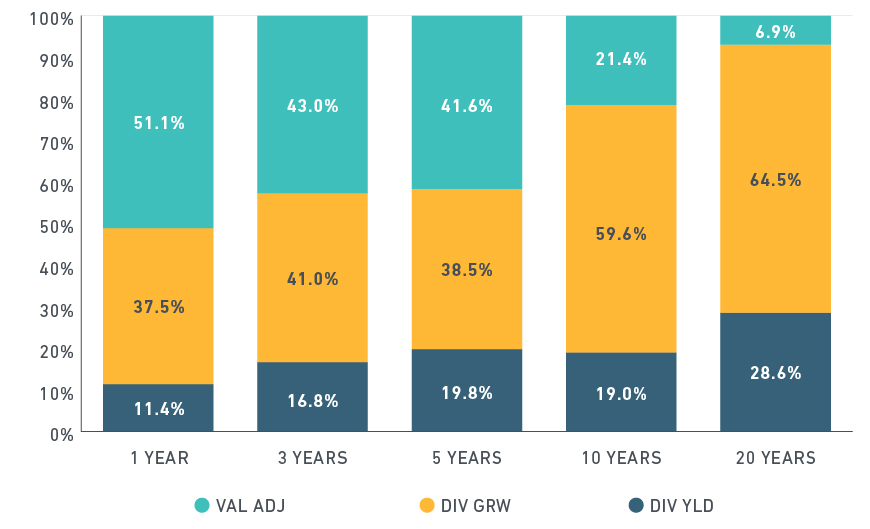
Valuation is important in the short-term, but over the long-term, it matters much less for equities than the growth rate of earnings and dividends. The chart below (from MSCI) decomposes the returns of global equities into three components: dividend yield, dividend growth and valuation adjustments. Over a one-year time frame, changes in valuation account for half the performance of equities. But over 20 years, valuation adjustments contribute just 7% to the total return, with dividends, and the growth of dividends, accounting for 93%.
Sentiment measures investors’ fear or optimism, and this is a gauge that is a contra-indicator. Investors (as a group) are generally rational, but investors are also human, and therefore, emotional. When pessimism and optimism exist they do so for very rational reasons. Think back to early 2009, when it seemed the world, at least the financial world, was falling apart. Well, it was falling apart. Investors’ fears were rational, and no one knew whether the financial system could be saved. Likewise, try to remember the euphoria of 1999. The internet had exploded, and all sorts of new products, services and applications promised to deliver a better world to billions of users of this new technology. That was all true, too. So the fear of early 2009 and the hope of late 1999 were both rooted in very real facts.
But the facts are only part of the equation for investors. The implied assumptions about the future in both cases, were ludicrous. In 2009, this was most evident in the credit markets. Prices for corporate bonds fell to levels that implied about one-third of all companies would file bankruptcy. In the depths of the depression in 1932, defaults never topped 20%. Was 2009 going to be worse than 1932? Possible, but very unlikely. Of course, there are many examples throughout history of insane euphoria. The Internet bubble of 1999 was one, but the best in my memory was Japanese real estate in 1989, when the land under the Imperial Palace in Tokyo was more valuable than all the land in California.
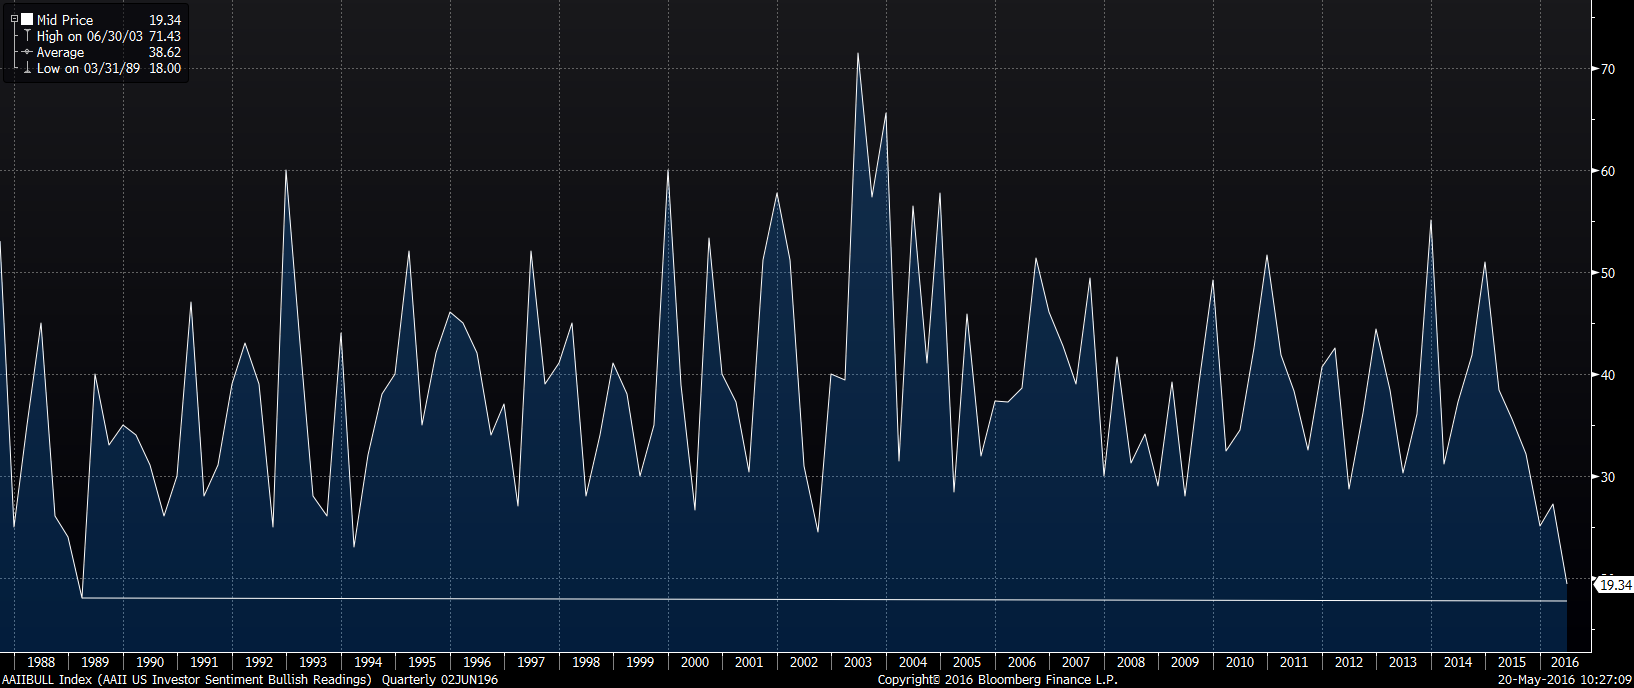
Investor pessimism and optimism are based on rational considerations, but when they swing to an extreme, I have found them to be excellent contra-indicators. The AAII survey is one such measure of hope and fear. Below is the percentage of investors who identify as bullish, which today is about as low as reported since 1989. There’s a lot to be pessimistic about, and many are. That’s really good news for investors.
So my view of the current market is somewhat neutral. Momentum is neutral over the past two years, but more positive looking longer-term. Valuation is not cheap, may be a little expensive, but not egregiously so. Sentiment is bearish, and that’s a positive sign. I put all these together below. Ideally, we would see positive momentum, cheap valuations and bearish sentiment. The triangle would be completely green then. But that will be the exception. Most of the time, the picture will be mixed. Of course, there are many more data sets and metrics I consider, only a few have been mentioned. And this exercise can be done across different markets, asset classes and time horizons.
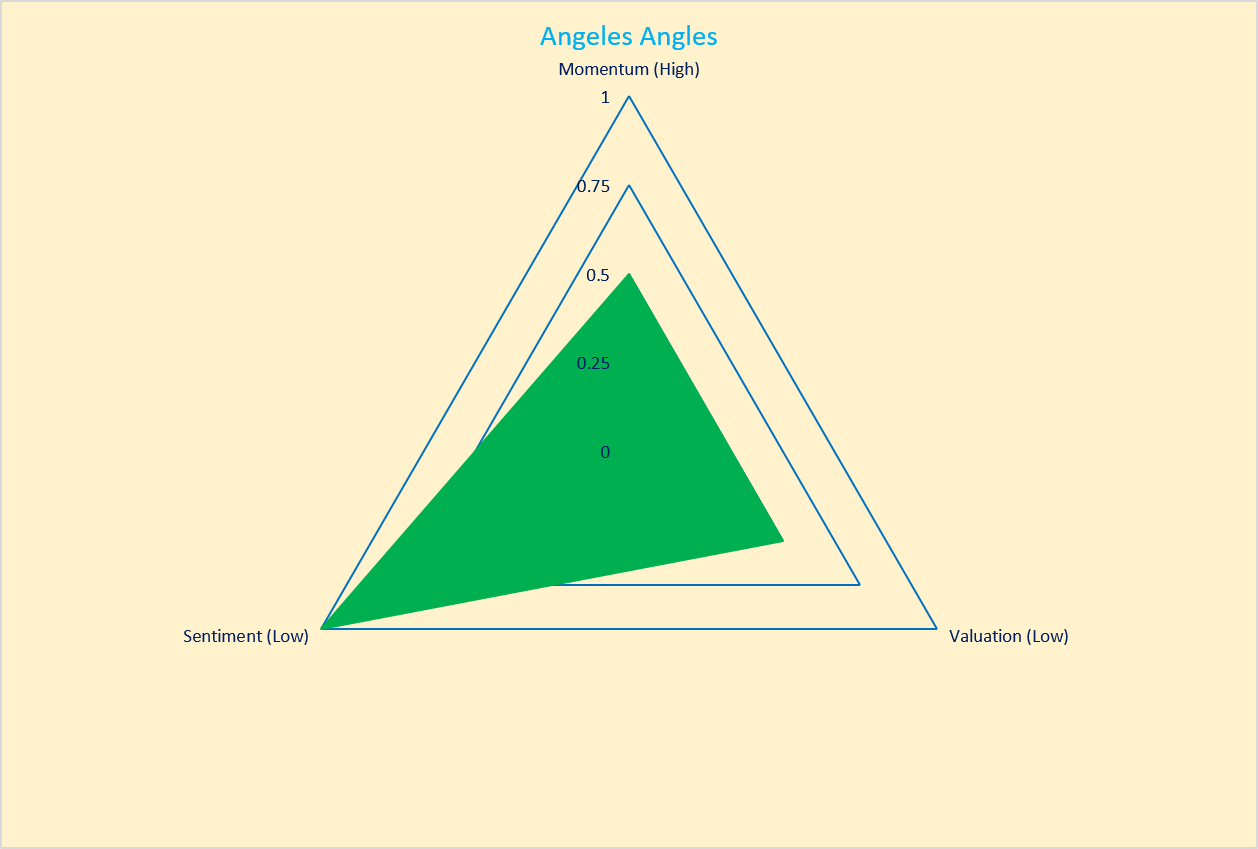
The long-term allocation should reflect the unique needs, risk tolerances and return objectives of each investor. But I find my triangle helpful in thinking about positioning portfolios, at the margin, because market conditions do change, creating new risks and new opportunities to consider in the context of these primary categories of momentum, valuation and sentiment. Good ideas often come from thinking outside the box, but when putting those ideas into action, I work inside the triangle.
PRINT THIS ARTICLE-
![Mismatch]()
Mismatch 03-20-2023
Bankers have always had a bad rap. Cicero, writing in De Officiis in 44 BCE, referenced Cato the Elder, the great Roman ...
READ BLOG POST -
![Jobs]()
Jobs 11-24-2014
There's no doubt that the headline unemployment rate (5.8%) does not tell the full picture of the job market. ...
READ BLOG POST -
![Consider]()
Consider 10-16-2014
Consider:Volatility spiked to its highest level in over 2 years.Global equities are in negative territory this year, led ...
READ BLOG POST
-


-
CONNECT WITH USSUBSCRIBE TO ANGELES' INSIGHTS


Get the latest investment information and stay on top of market trends.
SUBSCRIBE -
CONTACT US
![Location: Los Angeles]()
SANTA MONICA
429 SANTA MONICA BLVD
SUITE 650
SANTA MONICA, CA 90401
310.393.6300
GET DIRECTIONS -
![Location: New York]()
NEW YORK
375 PARK AVENUE
SUITE 2209
NEW YORK, NY 10152
212.451.9240
GET DIRECTIONS -
![Location: Houston]()
HOUSTON
5151 SAN FELIPE ST
SUITE 1480
HOUSTON, TX 77056
713.832.3670
GET DIRECTIONS


